
The Metropolitan Butterfly Observatory mBMS launches an interactive viewer data updated in real time
The Metropolitan Butterfly Observatory mBMS makes available to the public a data viewer that shows in real time the data of butterflies that volunteers observe in the parks and beaches of the project.
This data is constantly updated and every time a volunteer uploads a new butterfly census, it is automatically added to the viewer, so that the data can be consulted in real time.
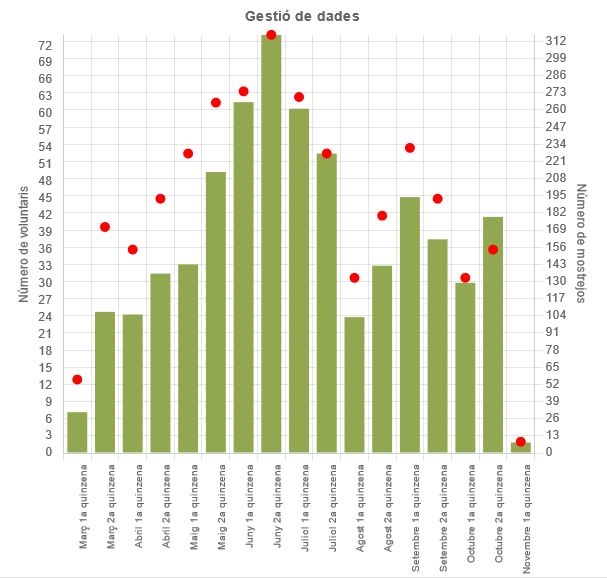
The viewer offers three blocks of information shown in form of two graphs and a table. The first graph corresponds to the volunteer activity data, showing the number of active volunteers (who have taken at least one census) and the number of census taken, all fortnightly. The second graph focuses on butterfly species, and tells us the total number of observed individuals of each species, as well as the average number of individuals observed for each census carried out by the volunteer.
Finally, the table of the species calendar is shown, where we can check, fortnight by fortnight, which is the period of time when each species is most seen. This information is provided with numbers and colors, so with just a glance we can see this information by looking at the intensity of the red color. In addition, by taking a general view of the table, we can detect which was the fortnight with more observed butterflies. Traditionally, this date is usually late May or early June, but this year, probably due to a cool anf dry spring, this peak has moved to late June and early July, as shown by the table.
One of the most interesting aspects of this viewer is the interactivity it offers. All this information can be consulted at three levels that interact with each other: by year of census, by species and by park or beach. In other words, we can consult the information for a precise year (from 2019 to the present), for a specific species (out of forty) or for a specific park or beach (out of 25). If we prefer, we can choose to display the information for all years, all species or all places, or a combination of all the options mentioned.
This improvement joins the Observatory’s interactive map where you can check the location of the parks and beaches and the exact location of the sections of each transect. In addition, for each park you can also consult the species observed, an image of each one, as well as its name in Catalan and Latin and its card in the CBMS.
All this information can be consulted on the LET page dedicated to the Butterfly Observatory. Without a doubt, this is a new tool open to the public that improves the accessibility of mBMS data.